


Chronic kidney disease (CKD) represents a major cardiovascular (CV) risk factor, with the rate of CV events increasing in proportion with the severity of the underlying renal dysfunction.1 CV events in CKD are only partly explained by the clustering of traditional risk factors, such as hypertension or diabetes, and are highly influenced by CKD-related systemic abnormalities, including volume and pressure overload, as well as uremic-related factors, such as indoxyl sulfate, β2-microglobulin and changes in mineral metabolism.2–4
Of note, rates of both atherosclerotic and non-atherosclerotic adverse events are increased in CKD patients, but the share attributable to the latter, especially heart failure and sudden cardiac death, becomes larger with the worsening of CKD.5 Indeed, at higher degrees of renal dysfunction, CV risk is mainly mediated by the hypertrophic cardiac remodelling termed ‘uremic cardiomyopathy’ (UC).6 UC is characterised by left ventricular hypertrophy (LVH) and dilation, with often preserved left ventricular (LV) ejection fraction and increased ventricular stiffness and diastolic dysfunction.7 Histologically, interstitial diffuse myocardial fibrosis is highly prevalent, as observed in postmortem studies performed in patients with end-stage renal disease (ESRD) who have undergone haemodialysis (HD).8 Interestingly, the extent of interstitial fibrosis is correlated with the decline in renal function, indicating that it can be considered a morphological marker of progressive cardiac involvement.9
Cardiac MRI (CMR) has the potential to provide a unique assessment of LVH phenotypes, including UC, being the gold standard for LV mass quantification and providing detailed tissue characterisation of myocardial architecture (both myocytes and extracellular space), with useful diagnostic and prognostic information.10,11 In recent years, CMR has helped expand our knowledge of UC, identifying pathological myocardial remodelling in CKD even at subclinical stages and potentially providing surrogate endpoints to better understand the effects of treatments or uremic factors on heart muscle.12 Moreover, native T1 and T2 mapping techniques are especially useful because they can be performed without the need for gadolinium, the use of which raised safety concerns in CKD patients. This review provides a focused update on recent advances and future perspectives of CMR tissue mapping in patients with CKD.
T1 and T2 Mapping
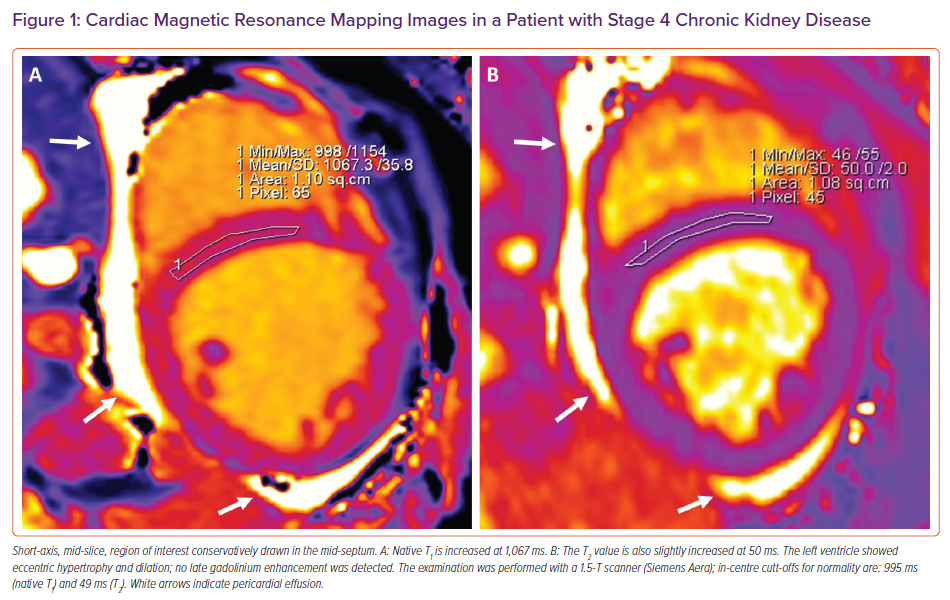
T1 and T2 mapping can provide accurate and parametric information regarding cardiac tissue composition. T1 mapping measures the course of longitudinal (or spin–lattice) relaxation, which is determined by how quickly protons re-equilibrate their spins after being excited by a radiofrequency pulse. Conversely, T2 mapping measures the course of transverse (or spin–spin) relaxation. Mapping sequences consist of the acquisition of multiple images at the same cardiac phase during multiple heart beats in a single breath hold per slice; the reconstruction of colour-coded maps in which every voxel displays a colour intensity according to its T1 (or T2) value allows for parametric estimation of T1 (or T2) values within a specific region of interest (ROI; Figure 1).
Native T1 is an extremely sensitive although non-specific readout that relates to a number of underlying diseases.13 Most of the pathogenic processes involving the heart muscle, including those causing oedema, fibrosis and amyloid infiltration, lead to an increase in native T1 values, whereas the deposition of iron or fat leads to a decrease in T1 value.13 Conversely, an increase in the water content of myocardial tissues is the main cause for longer T2 relaxation times; therefore, myocardial oedema is the main pathology responsible for elevations in T2 values. Normal ranges for T1 and T2 mapping vary according to field strength, machines and the software used for the evaluation.14,15 Finally, using pre- and post-contrast myocardial and blood pool T1 values, along with the haematocrit, an estimated extracellular volume (ECV) fraction is calculated.16 In principle, calculation of ECV and intracellular volume (ICV) may help understand the underlying nature of LVH, where hypertrophy may, in some cases, be primarily driven by cellular hypertrophy rather than an increase in ECV.17,18 However, given concerns related to the use of gadolinium-based contrast agents (GBCAs) in CKD, scarce data are currently available for ECV assessment in these patients.
Native T1 Mapping
Several studies have investigated native T1 mapping findings in patients with CKD, invariably compared to healthy controls or hypertensive subjects. Of note, T1 values were found to be consistently increased compared with controls.19–22 Interestingly, a significant increase in native T1 values has been observed even in patients with only moderate renal disease (mean estimated glomerular filtration rate 50 ml/min); this finding was unrelated to conventional CV risk factors and was detected in patients who had not developed a significant increase in LV mass compared with a reference control group.23 This suggests a major role of CKD-related factors in driving increases in T1 values, as well as the very sensitive nature of native T1 as an imaging biomarker, able to detect pathological changes even in the absence of identifiable LVH.
Observational studies performed in patients with more advanced renal disease are consistent with the ability of native T1 in tracking the progression of cardiac remodelling. In patients with ESRD, native T1 values were increased compared with those in control groups.20,21 In these studies, a correlation was found between increasing T1 values and UC progression (i.e. increasing LV mass and reduced longitudinal and circumferential strain). Further data from a larger, unselected population of patients referred for a clinically indicated CMR study found native T1 values progressively increased across renal disease strata, with higher values in patients with more severe CKD and a significant association between native T1 values and CMR-derived pulse wave velocity as an index of vascular stiffness.24 Moreover, native T1 values were independently associated with clinical variables, such as physical function and cardiac biomarkers.20,25,26
A recent cross-sectional study demonstrated a graded increase in native T1 values that, with declining renal function, was an independent predictor of peak oxygen uptake during cardiopulmonary exercise testing.27 Together, these data suggest that native T1 values can track the progression of adverse remodelling; increases in native T1 values are observed early, even when LV mass is unaffected or the small changes in LV mass are undetectable, and are associated with the progression of UC and deterioration of clinical status.
Some factors should be considered when assessing native T1 values in patients with CKD. The presence of replacement fibrosis, as identified by late gadolinium enhancement (LGE) imaging, is a major confounder when interpreting native T1 as a measure of diffuse fibrosis. Indeed, in this case higher values reflect scarring rather than diffuse disease; hence, LGE areas should be carefully excluded when drawing the corresponding ROIs.28 In patients with CKD this cannot be always done, because many would be offered non-contrast examinations due to concerns related to nephrogenic systemic sclerosis.
Some studies performed before regulatory restrictions regarding the use of GBCAs in CKD investigated the presence of replacement fibrosis. In these studies, LGE was described in approximately one-third of cases, often of the non-ischaemic type and unrelated to traditional CV risk factors.29,30 It should be noted that the use of newer, stable macrocyclic GBCAs, which have a lower risk of nephrogenic systemic sclerosis, may afford patients with CKD the opportunity to have LGE imaging performed.31
A recent study in CKD patients referred with a clinical indication for contrast CMR imaging found that LGE prevalence was similar to that described previously.26 Although in diffuse diseases the method of a conservative mid-septal ROI is suggested for assessing native T1, areas of visually increased signal may be found, suggesting local fibrosis.32,33 A study sought to investigate the ability of native T1 to identify replacement fibrosis in aortic stenosis as a model for use in ESRD, but a defined threshold for the identification of scarred areas could not be identified.34
Another putative factor possibly influencing native T1 assessment is volume overload, although contradictory data are currently available in the literature. One study observed higher native T1 in HD patients compared with controls, with T1 values being positively correlated with pre-HD volume status as assessed by bioimpedance.35 Conversely, another study investigated native T1 in HD patients, also testing inter-study, interobserver and intraobserver variability, finding high reproducibility of the measure and that it was not correlated to detected changes in body weight as a proxy of altered volume status between scans.36 A limitation of both these studies is their small sample size.
In summary, native T1 seems to be invariably increased in patients with CKD, even compared with patients with normal renal function and a similar prevalence of traditional CV risk factors.26 This makes it an effective marker of disease in UC, reflecting the increase in diffuse myocardial fibrosis with worsening renal function. Despite the presence of underlying confounding factors and a lack of histological validation, this hypothesis is largely consistent with results from pathological studies.8,9
T2 Mapping
Fewer studies investigating T2 mapping are available compared with T1 mapping studies. Most reports have highlighted increased T2 values in patients with CKD,22,37–39 whereas others have not.40 Studies investigating T2 mapping values before and after HD sessions revealed a reduction in T2 values after HD, where the reduction in T2 values was put in relation to either the reduction in LV mass or to the volume removed during HD sessions.26,41 Together, these results support the hypothesis that treatment of volume overload can affect myocardial water content, possibly mediating an improvement in cardiac function.42 In contrast, there are some data in which T2 values did not change between HD patients and controls, specifically when CMR examinations were systematically performed the day after dialysis at a time of relative euvolemia.40 These findings indicate that achieving strict control of volume status may help reducing the influence of underlying myocardial oedema on native T1 assessment.
Associations between increased T2 and both troponin and B-type natriuretic peptide in patients with CKD have been described, hypothetically pointing towards a role for myocardial oedema in ongoing cardiac damage in the context of renal disease.26,39 These preliminary observational findings on T2 mapping in CKD need to be confirmed by further studies in order to establish any cause–effect relationship and fully assess whether oedema itself could contribute to myocardial remodelling by inducing structural changes within the interstitium.43
Longitudinal Changes in T1 and T2 Mapping
Several studies have explored longitudinal changes in mapping parameters in patients with CKD. Potentially, T1 and T2 mapping techniques can provide useful surrogate endpoints to assess the response to any novel treatment approach, as well as to early identify incipient CKD-related cardiac damage.33,44 In this context, native T1 effectively served as surrogate endpoint in a randomised trial exploring the effect of a program of intradialytic cycling, which was associated with reductions in LV mass, native T1 values and pulse wave velocity.45
In patients with moderate CKD, longitudinal examinations revealed stability of native T1 values, likely explained by the low severity of renal involvement, as well as the relatively short time interval between examinations.23 In ESRD, native T1 has been assessed in patients with incident HD (under HD from <1 year) in which 6 months of standard care was associated with a reduction in LV mass and troponin, albeit unchanged T1 on average; however, the difference in the LV mass index over the duration of the study was greater in those whose T1 time fell, suggesting ongoing positive cardiac remodelling effectively imaged by CMR.46 In addition, CMR provided surrogate endpoints in a study testing different HD modalities.47 Interestingly, nocturnal in-centre HD was associated with positive cardiac remodelling, including reductions in LV mass and native T1.47
Kidney transplantation (KT) has been described to have benefits on cardiac function and UC.48,49 There are only a few studies investigating the longitudinal changes in native T1 in patients undergoing KT, and the data are conflicting. In one study, native T1 was described as increased 2 months after KT.37 Others have described reductions in native T1 at least in a cluster of patients without diabetes and relatively low LV mass.50 Further analysis from that last cohort revealed that T1 values did fall after KT and that cardiac deformation improved.38
More studies with larger sample sizes and longer follow-up times are needed to assess the long-term cardiac effects of KT. Overall, T1 and T2 mapping techniques seem attractive to monitor longitudinal cardiac remodelling in patients with CKD. Combined assessment of native T1 and T2, as well as strict achievement of similar volume status between serial examinations, could be considered to reduce the influence of confounding variables.
Knowledge Gaps and Future Perspectives
Native T1 as a marker of diffuse myocardial fibrosis has been validated in several diseases, including aortic stenosis and dilated and hypertrophic cardiomyopathy.51,52 Although a similar association is highly likely present in UC too, no studies to date have attempted to provide such a validation. Of note, a trial is underway in which postmortem evaluation of myocardial fibrosis will be compared with CMR mapping (NCT03586518); this assessment would help to further strengthen the concept that native T1 can track the progression of diffuse myocardial fibrosis in patients with renal disease. UC is a diffuse disease, in which, according to currently available data, focal LGE areas may be present but not involved in determining prognosis.29
Conversely, native T1 has been shown to be related to increased N-terminal pro B-type natriuretic and reduced physical function in UC, suggesting that it could potentially be a valuable marker of clinical status in CKD.25,26 Native T1 has been demonstrated to be a prognostic marker in several clinical conditions.28,53–55 However, to date, no study is available investigating the prognostic role of native T1 in UC. Preventing sudden cardiac death in patients with UC is an unmet need.56 Changes in cardiac morphology are associated with ECG abnormalities, further exaggerated by the occurrence of electrolyte imbalance, especially in people undergoing HD.57
The influence of diffuse fibrosis in the genesis of major arrhythmias is an attractive subject of investigation, and a study deriving post-contrast T1 values from inversion time (TI) scout images of patients undergoing ventricular tachycardia ablation found reduced survival free from recurrence in those patients with lower values, which indicate higher fibrosis burden.58 In patients with CKD, an association between increased native T1 and longer QT interval has been described.20 However, more specific research on this topic is currently lacking.
Conclusion
CMR T1 and T2 mapping techniques expanded our ability to provide early identification and sensible tracking of disease progression in UC. An increase in native T1 represents the development of diffuse interstitial fibrosis, whereas a contribution of myocardial oedema, identified by increased T2 mapping values, is likely present at least in a subset of patients. Outcome studies are needed to assess the prognostic relevance of T1 and T2 mapping in patients with UC.